This is an electronic version of the presentation made by Professor Larry Taylor on 10 January 2001, at the White House Diamond Conference. He was asked by the Office of Technology to display this lecture on the web for the general public. Each figure can be enlarged for more detailed viewing by clicking on it.
 |
Dr. Lawrence A. Taylor Planetary Geosciences Institute University of Tennessee Knoxville, TN 37996 Phone: 865-974-6013 E-mail: lataylor@utk.edu Web: http://pgi.utk.edu |
 |
This talk will present a tutorial on the science of naturally occurring diamonds, specifically certain physical and chemical properties of diamonds and their mineral inclusions. Two important research areas will be elaborated: Spectroscopic and Stable Isotopes Analyses. In addition, the physical nature of diamond will be discussed to put the analyses into proper perspective. Lastly, an evaluation of possible techniques for identifying the geographic locations of diamonds will be discussed. (Fig. 1)
(Slide 1/21) |
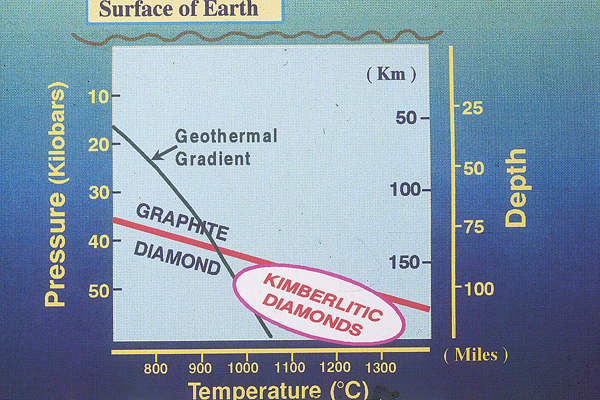 |
Before we start, I think that I should emphasize the extreme pressures and temperatures under which diamonds form — pressures of 40-60 kilobars (~ 40,000-60,000 atmospheres = 6-9 X 10⁵ lbs./in2) and temperatures from about 1100-1400 oC (2000-2500 oF), representative of depths within the Earth of 120-180 km ( ~100 miles). (Fig. 2)
(Slide 2/21) |
|
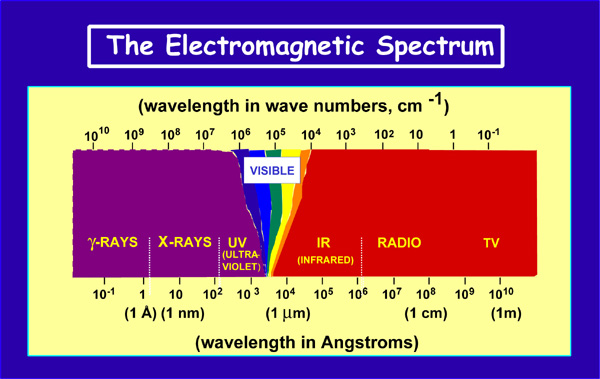
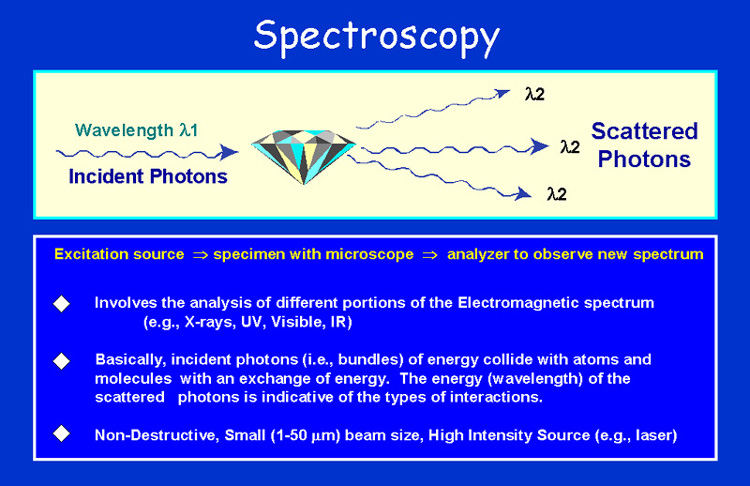
As a means of introducing the field of Spectroscopy, the Electromagnetic Spectrum is shown to illustrate the different wavelengths (energies) that are involved. In various types of spectroscopic analysis, a beam of energy (e.g., photons, electrons) is focused onto a diamond (or other substance) and interacts with the physics and chemistry of the compound. The resulting emission of energy due to scattering and absorption of the impinging energy is measured. This is indicative of various processes occurring within the diamond. The focusing of the energy can be done with a lens system or by use of a laser. Such analysis is non-destructive and can be used for identification of properties within the diamond. (Fig. 3)
(slide 3/21) |
 |
This slide elaborates on some of the different types of spectroscopy that are used in diamond research. Cathodoluminescence (abbrev. CL; wavelengths in the visible region) is commonly used to discern zonations in diamond, as these reflect upon the growth ancestry of the diamond in the mantle. Infrared spectroscopy, more commonly referred to as FTIR due to a Fourier Transformation of the signal, examines spectra just above the visible region. Such analyses are particularly useful for determination of nitrogen-aggregation in diamond, as will be discussed below. Raman spectroscopy is used to identify solid and fluid inclusions both on the surface and deep within diamonds, both qualitatively and quantitatively using a non-destructive laser beam of @1 micron spot size (micron = mm = micrometer = 10-6 mm). (Fig. 4)
(slide 4/21) |
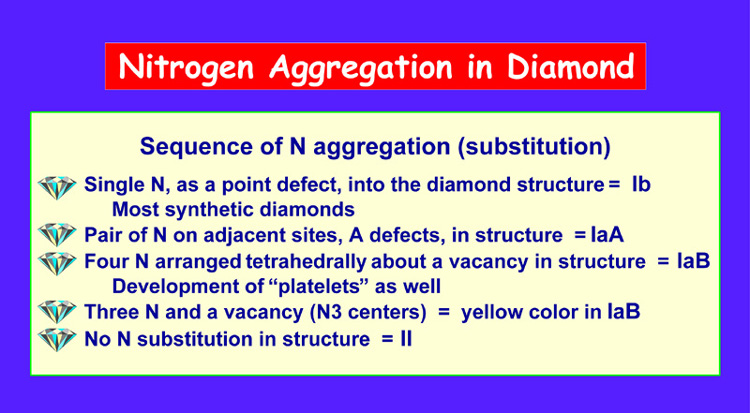 |
Nitrogen can substitute in the carbon structure of diamond up to 3000 ppm (0.3 wt.%). It can also arrange itself relative to other nitrogen atoms such that it has different states of aggregation. The differences in the sizes and electronic configurations of the C and N lead to defects in the overall cubic closest packing of the structure. For example, if a single N substitutes for C, only a small defect is generated in the diamond structure, and this is called Ib aggregation, which occurs in most synthetic diamonds. If a pair of N occurs on adjacent sites within the diamond structure, an A defect forms, resulting in IaA nitrogen aggregation. When four N atoms are in a tetrahedron about a vacancy in the diamond structure, a B defect forms, and IaB nitrogen aggregation occurs. Along with the IaB aggregation is the formation of small platelets of N. Sometimes 3 atoms of N and a vacancy may substitute for 4 C atoms forming N3 centers, which commonly give a yellow color to IaB aggregated diamonds. Each of these different nitrogen- aggregation states affects the structure of the diamond, with consequent changes in its physical properties, such as hardness. (Fig. 5)
(slide 5/21) |
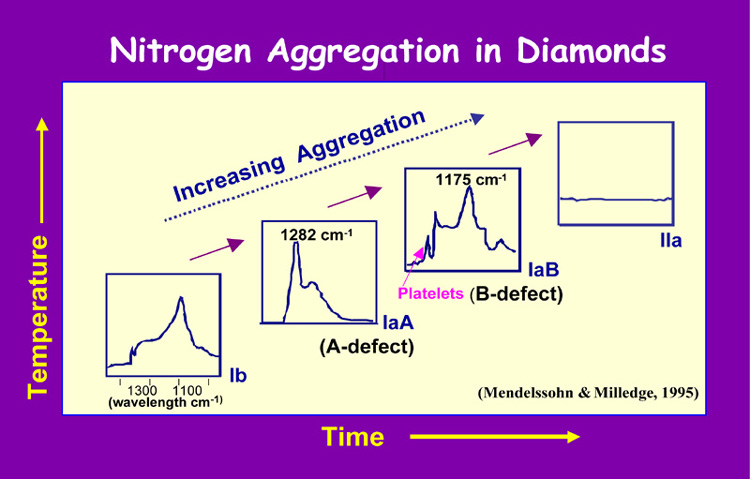 |
It is reasoned that when a diamond first forms in nature, it incorporates some N into its structure. With annealing over long periods of time (e.g., millions of years) and at high temperatures (e.g., 1100-1400 oC), aggregation of N occurs in the scheme as shown. This does not mean that a diamond will be all of one type of N aggregation; indeed, as shown below, diamond seldom is of only one type, but a mixture of different degrees of N aggregation, dependent upon the prevailing chemistry and physical conditions at the time of the growth of that particular portion of the diamond. (Fig. 6)
(slide 6/21) |
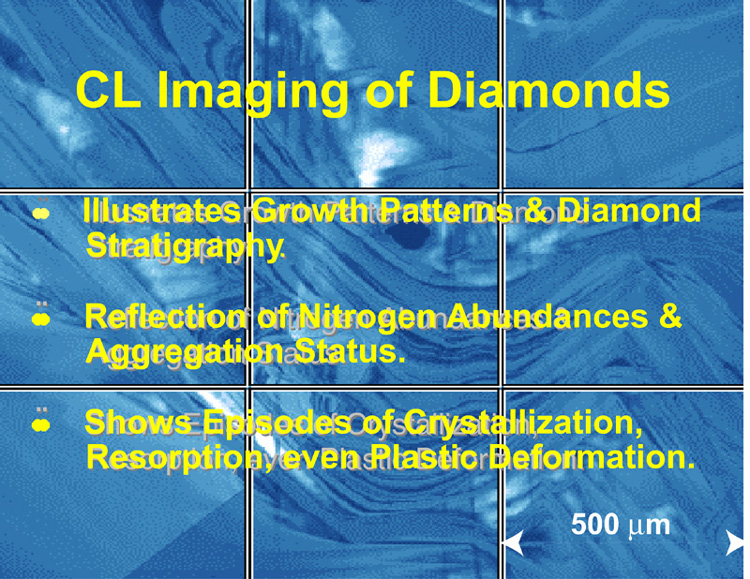 |
Cathodoluminescent (CL) imaging on properly prepared sections of a diamond reflects the entire growth history of a diamond, from initial nucleation and growth throughout its life, all the way to the time of eruption in the kimberlite/lamproite volcano. This can include periods of hesitation, resorption of the diamond due to changing P-T conditions, possible plastic deformation, renewed growth in a different growth mode (octahedral vs. cubic), with a final rim effectively coating the diamond. Note the complicated zonation pattern of the diamond in the background. (Fig. 7)
(slide 7/21) |
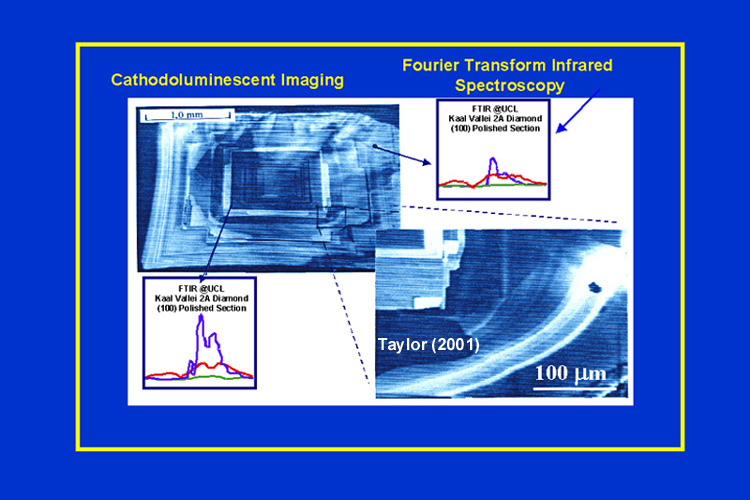 |
The CL imaging of a diamond cut and polished along the (100) face. Note the different zonations caused by different N contents and N aggregation states. The core zone is homogeneous and is followed by successive zones of the diamond. The FTIR patterns, as determined by the author and Dr. Judith Milledge, at University College London, demonstrate distinct differences in N aggregation states between the core and the rim zones (compare FTIR tracings to those in Figure 6). Note the enlargement that shows that the growth has not been continuous, but has been interrupted by periods of resorption, as shown by the discontinuities in the zonation patterns. (Fig. 8)
(slide 8/21) |
 |
This diamond from Yakutia displays a N zonation that is not particularly complicated. Yet closer examination shows overlapping zones formed during resorption and change in growth modes. (Fig. 9)
(slide 9/21) |
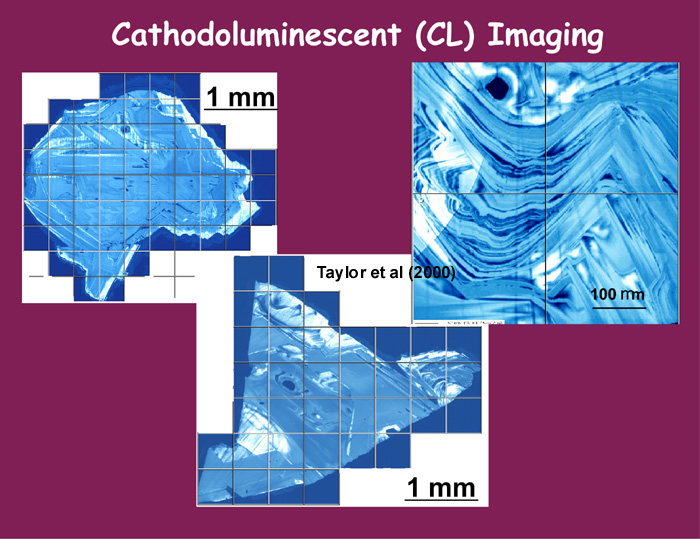 |
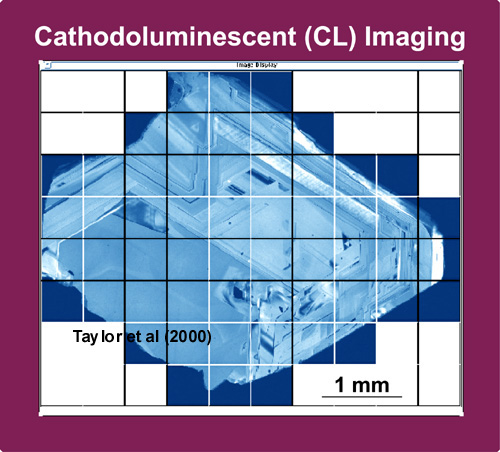
The CL imaging of both a rather simply zoned diamond (upper left) and an extremely complexly zoned diamond (center with enlargement in upper right. This diamond from the Udachnaya pipe in Yakutia (Taylor et al, 2000), with its contorted patterns, contains a pyroxene inclusion shown as a black cubic-euhedral spot on the top of the enlargement. It is the chemistry of such inclusions that may be related to the diamond zonations. (Fig. 10)
(slide 10/21) |
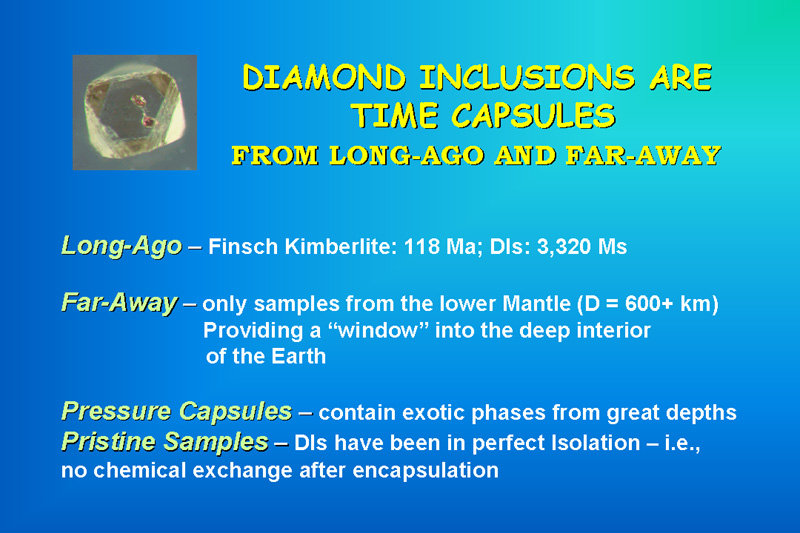 |
Diamond inclusions (DIs) are the impurities that jewelers hate, but scientists treasure as nuggets of data from within the diamond time capsule. These minerals, which were included in the diamond as it grew, reflect the environmental conditions prevailing at the time of the diamond growth at that particular point in time and space. These DIs relate directly to the host rocks which contain the diamonds, with the two main rocks being peridotites and eclogites. (Fig. 11)
(slide 11/21) |
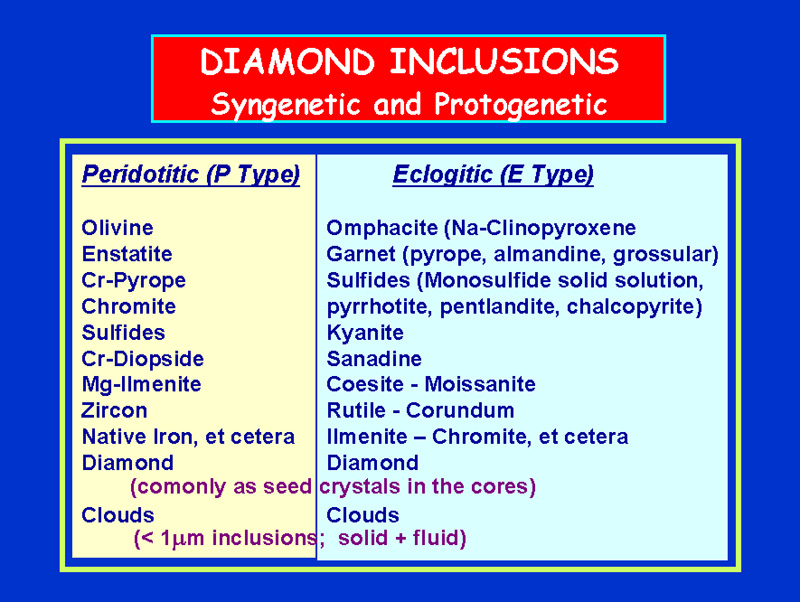 |
Numerous mineral have been reported as DIs, some which have formed deep (>600 km) within the mantle and were only known from high-P experiments prior to their discovery as DIs. The presence of particular minerals in a diamond is the method for the geologic classification of diamonds into P (peridotite) and E (eclogite) types. (Fig. 12)
(slide12/21) |
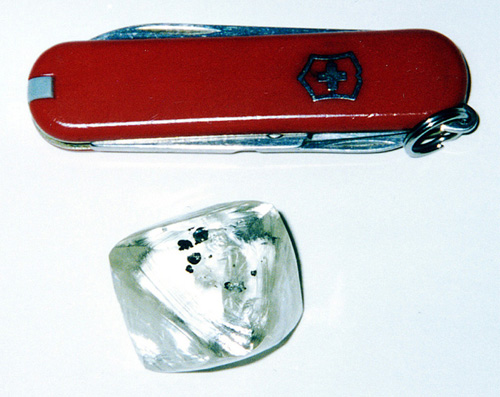 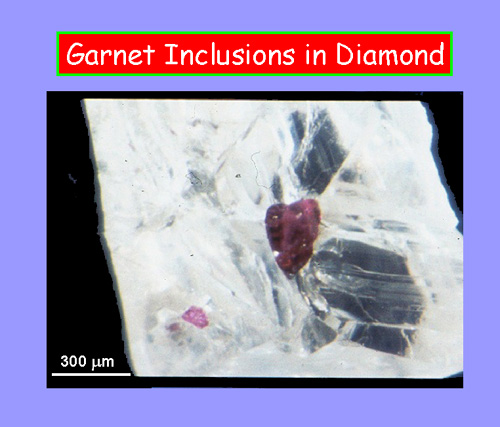 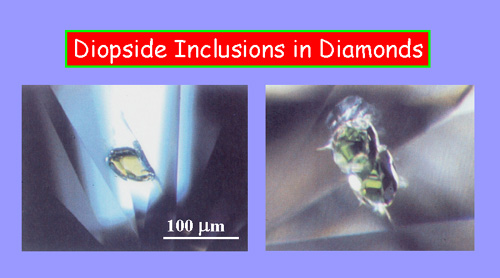 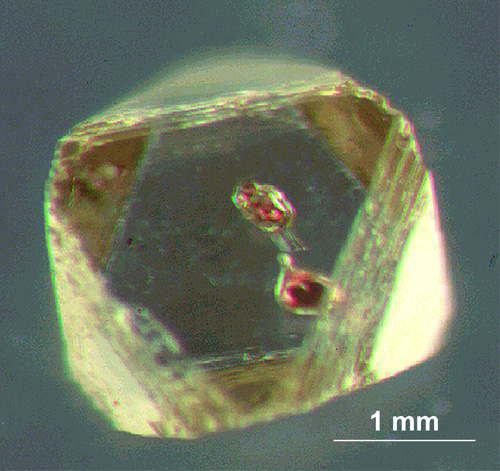 |
Shown left are a 112 carat gem-quality diamond (from Yakutia) with several inclusions and smaller diamonds with both green pyroxene (diopside) and red garnet inclusions. (Fig. 13)
(slide 13/21) |
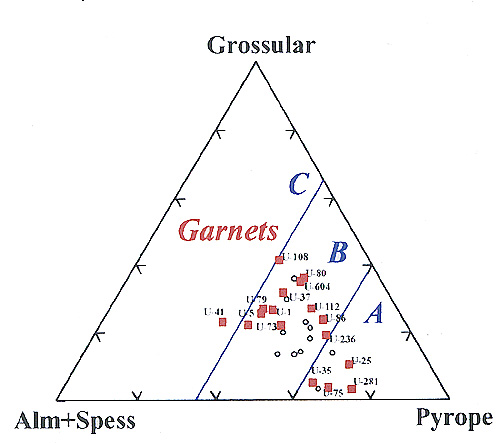 |
The compositions of the diamond inclusions, as well as the minerals in their host rocks, are determined with an Electron Microprobe (EMP). This instrument focuses an electron beam onto the mineral, which gives off photons of X-ray energy indicative of the elemental compositions of the mineral. This figure shows the compositions of garnets from E-type diamonds and eclogitic hosts from the Udachnaya kimberlite in Yakutia (after Taylor et al., 2000). Notice that the garnet compositions from but one kimberlite range greatly such that the composition of a garnet DI is not indicative of even a particular kimberlite, let alone a country. The same is true for the major- and trace-element compositions of most DIs. (Fig. 14)
(slide 14/21) |
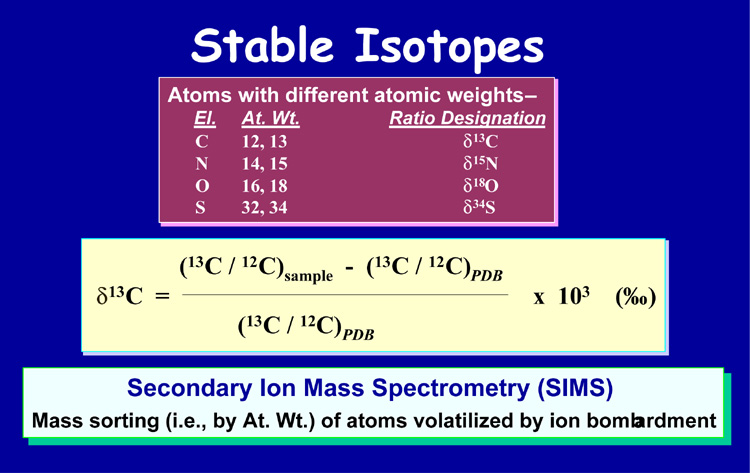 |
Stable isotopes are atoms of an element that contain different numbers of neutrons, but the same number of protons. The isotopes are usually measured as ratios of pairs and compared to standards (cf., SMOW = Std. Mean Ocean Water). The isotopic notation is given as “delta 13 Carbon”, for example, and is in units of parts per mil (o/oo). The isotopes measured on diamond are d13C and d15N, with d18O on silicate minerals and d34S on sulfide minerals. These stable isotope analyses are commonly performed on a Secondary Ion Mass Spectrometry (SIMS). This instrument bombards the mineral with charged ions and volatilizes a small portion of the phase into charged particles, which are accelerated and sorted by their different atomic masses (e.g., 13C vs. 12C) in a mass spectrometer. (Fig. 15)
(slide 15/21) |
|
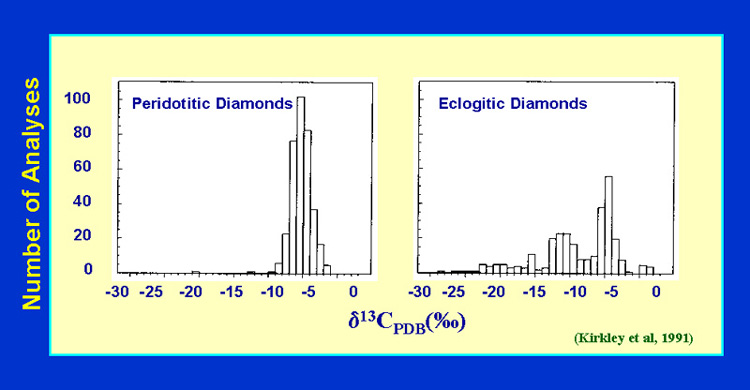
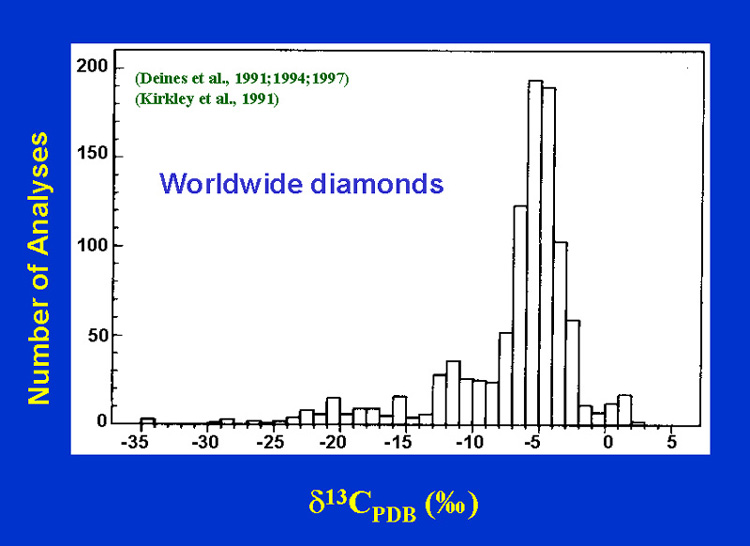
The carbon isotopics of diamond vary considerably from +5 to -34 o/oo. As shown, the eclogitc diamonds have an extended range of d13C, possibly due to some biogenic activity which partitions the 13C versus 12C. This may be a signature that the carbon was originally of crustal origin, near the surface of the Earth, brought into the mantle by subduction. The same type of extended range exists for d15N in diamond, again a possible signature of subducted oceanic crust. (Fig. 16)
(slide 16/21) |
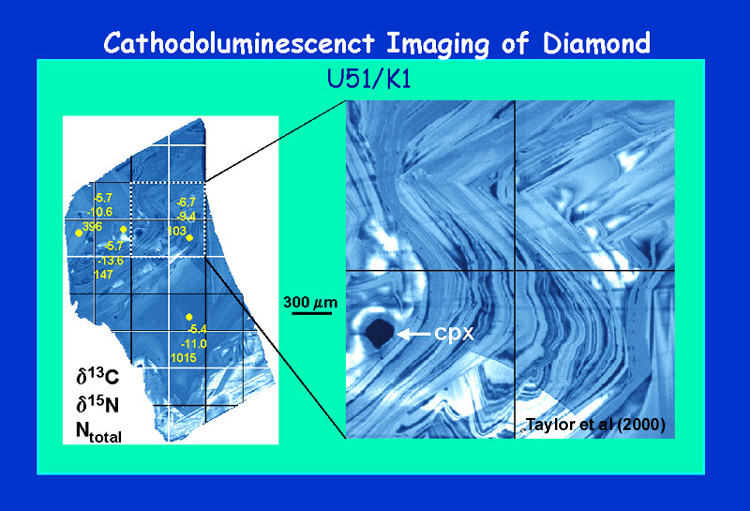 |
This is a CL image of a diamond from Udachnaya, Yakutia, also shown in Figure 10, which has been analyzed by SIMS for d13C, d15N, and Ntotal (values presented: top to bottom on figure). Note that the d13C does not vary greatly from one point in the diamond to another, such as can occur in some diamonds. However, the d15N varies from -9.4 to -13.6 o/oo within only 0.5 mm, while the total N content varies by a factor of 10X. Extreme differences in C and N isotopes and N contents can occur within one diamond such that these properties of diamonds do not permit distinctions to be made between kimberlites. (Fig. 17)
(slide 17/21) |
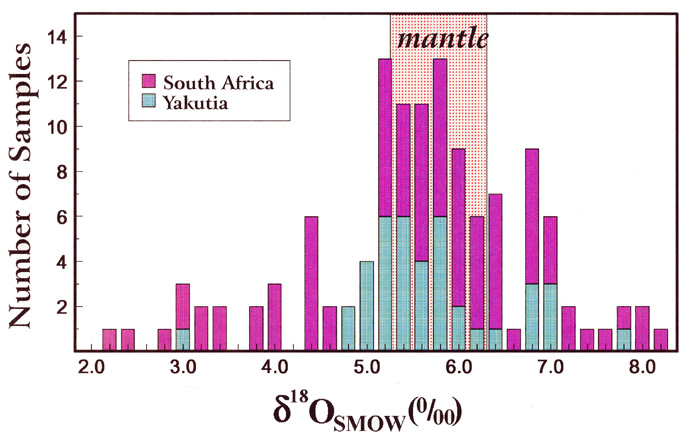 |
Oxygen isotopes are commonly determined on both DIs and the minerals in the host rocks for the diamonds. Most of these values are considered typical for mantle d18O (~5-6 o/oo ). However significant numbers of DIs and host minerals have d18O values which are above and below mantle values. These are considered to be signatures of crustal protoliths (parent rocks) that were subducted beneath the continental cratons, where the diamonds were formed. (Fig. 18)
(slide 18/21) |
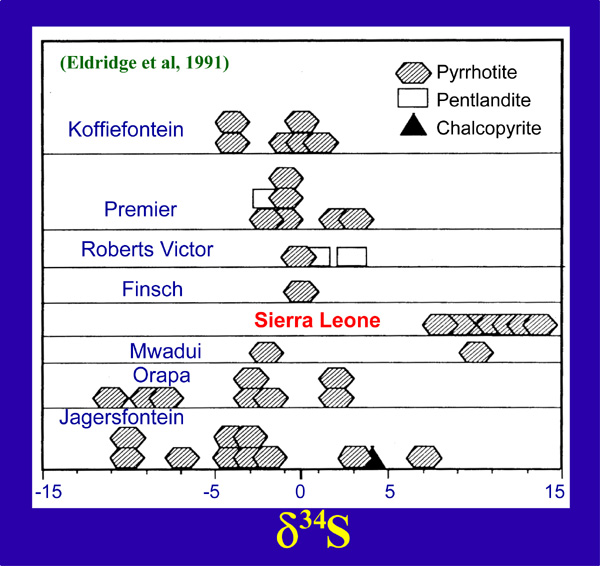 |
The most common diamond inclusion is a sulfide phase called monosulfide solid solution (MSss), which breaks down to form the minerals, pyrrhotite (Fe1-xS), pentlandite (FeNi9S8), and chalcopyrite (CuFeS2). The d34S values of these sulfide minerals vary considerably from +14 to -11 o/oo, thought to be due to former biologic activity in the crust, which upon subduction, becomes the major reservoir for sulfur activity. This figure illustrates the variations in d34S in diamond inclusions from several kimberlite locales in Africa. Notice that the d34S for the sulfide DIs from Sierre Leone are distinctly higher than those from the other locales. However, it must be emphasized that this apparent difference in d34S is only based on a handful of DIs from Sierra Leone, certainly not a statistical treatment. However, these d34S results have good potential for a means of discriminating diamonds from this geographic region. (Fig. 19)(slide 19/21) |
| This is a cartoon taken from Taylor and Neal (1989) that depicts what is now considered to be the tectonic regime for the subduction of oceanic crust to beneath the Kaapvaal Craton of southern Africa. The oceanic section, with all its crustal signatures (i.e., d13C, d15N, d18O, and d34S, among others), has undergone metamorphism upon subduction, accompanied by devolatilization and partial melting. At greater depths, the crustal rocks undergo a high P & T transformation to form eclogites, and underplate the craton near its Keel. Sometime later, the diamonds are formed, most likely due to crystallization from fluids rich in C-N-S and probably hydrogen (Taylor et al., 1998). The diamonds may have formed 2-3 billion years ago, but they were brought to the surface in kimberlite volcanoes only about 100 million years ago – i.e., old diamonds in young kimberlites. The kimberlites are only the transportation means for bringing the diamonds up from great depths. (Fig. 20)
(slide 20/21) |
DETERMINING THE GEOGRAPHIC ORIGINS OF DIAMONDS
- No Known Scientific Means Exists for Polished Diamonds;
- Trace-Element Diamond Chemistry may be Used, But Lots of Research Needed;
- Diamond-Coating Compositions by Raman Spectroscopy are Possible;
- Sulfur Isotopes of Diamond Inclusions are Distinctly Possible;
- All Possibilities Mentioned Above, as Well as Others, Require Expensive, Sophisticated Scientific Instrumentation (i.e., not suitable for ‘field’ monitors);
- The Same Prerequisite Exists for All these Possible Techniques – New, Large Populations of Diamonds from Known Locales are necessary with which to Gather Sufficient Statistics;
- The Potential for the Development of a Scientific Identification Technique(s) Exists, BUT a Detailed Research-Funding Program Must be in Place to Assure Success.
(slide 21/21)